

Maslow Groups, Values Modes and OCEAN Part 1
Developing Psychological Insights through Data
I have been asked by multiple readers on several continents about the correlation between Cultural Dynamics Strategy and Marketing Ltds (CDSM) values based segmentations and the much written about personality-based segmentation used by Cambridge Analytica, that is claimed to be a difference maker in the surprise election of Donald Trump to the US Presidency.
Many political commentators seem to view this as new and something of a secret weapon, but it is not. Indeed, the BBC ran a viewers and listeners survey in conjunction with Cambridge University from 2009 to 2011. The OCEAN (or Big 5) personality survey was responded to by over 400,000 people in the UK (self-selected and not representative of the total UK population). This produced some interesting data and was widely published in most national newspapers at the time.
 British propensities on the Big 5 factors as reported by respondents to the BBC hosted website
2009 to 2011.
British propensities on the Big 5 factors as reported by respondents to the BBC hosted website
2009 to 2011.
The Big 5, developed from initial lexical analysis in the 1940s by Cattel and structured into the Big 5 by Goldberg in the 1980s is most commercialized by Costa and McCrae through personality inventories also developed in the 1980s. This is one of the most researched personality inventories in academia and is used widely by many commercial organizations, where it is usually characterized as OCEAN an acronym for the five factors it measures:
- Openness (to change)
- Conscientiousness
- Extraversion
- Agreeableness
- Neuroticism
A variety of scales of varying length and content, many developed in academia and peer reviewed, have been developed and used by researchers over the years.
For over three decades the directors of CDSM have been measuring and analysing the differences between values a deep, consistent set of beliefs and motivations that guide perceptions and attitudes; and personality the way these values are presented to others. This work can be full of semantic difficulty and sometimes impenetrable jargon. OCEAN has been found to be a set of scales that can add an extra dimension when users are trying to understand a person, or people in groups.
Cultural Dynamics Strategy and Marketing Ltd has been running one of the academically peer-reviewed scales measuring OCEAN for several years. The scales have been presented in our British Values Surveys, which asks for responses to hundreds of scales - from a statistically balanced random sample of 2,000 to 5,000 adults aged 16 to 85.
A little over a year ago the same tests were administered to over 10,000 statistically balanced representative adults in not only the UK, but also in Germany, France, Italy and Spain.
The results from the OCEAN model have been used to inform a wide variety of business or organizational disciplines in a range of clients in the last several years. Because of this, new insights have been developed about human personality and the impact this has on organizational and national cultures usually in conjunction with Maslow Groups or Values Modes.
The following maps will highlight just some of the insights available.
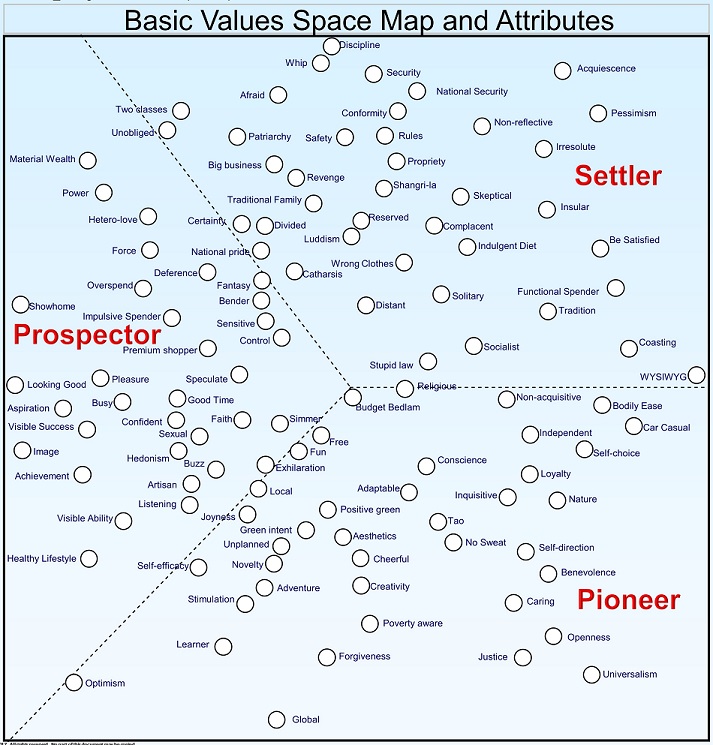
Values Space and Attribute Map
Many readers will be familiar with the Values Map and its 108 Attributes, recognising the clarity it brings to a complex understanding of cultural psychology. New readers to the the site can refer to other analysis here to gain an understanding of the factors discussed in these short articles.
The first map shows the CDSM Values Map, the 108 Attributes of the whole values system of the UK and the the areas of the maps delineated showing the spaces where the values of the three Maslow Groups Pioneer, Prospector, Settler are most likely to be over indexed compared to the rest of the population.
The second Map illustrates the OCEAN factors within this same space. This overlying of personality factors on the values factors is a first stage of analysis that helped CDSM begin to understand what and how personality measures could be correlated rationally with values research and to what extent the findings were useful to decision makers.
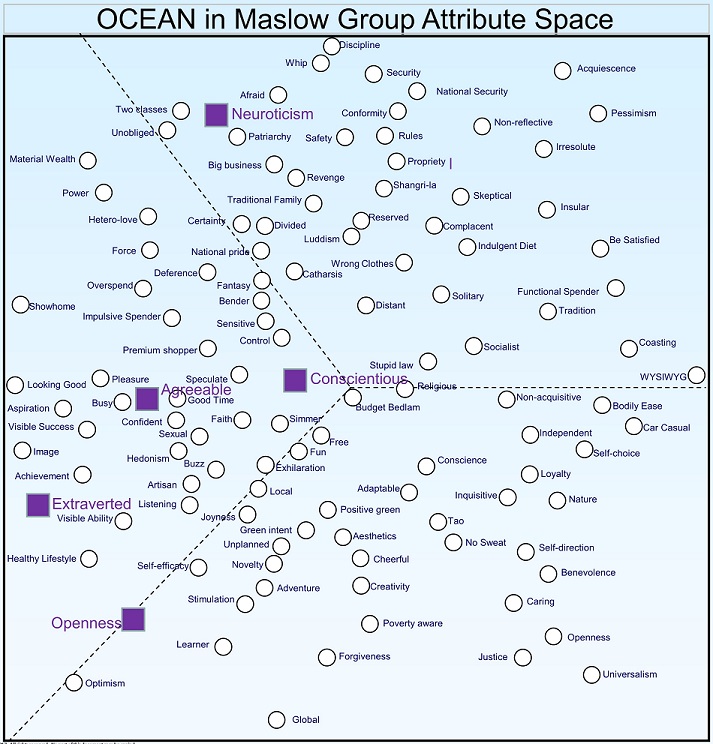
The data clearly shows the OCEAN model measures factors that cluster heavily, and differentiate, within Prospector space. Two factors rest slightly outside, or on the border of this space Neuroticism within the Settler space and Openness borderline with the Pioneer space. Similar orientations have been noted in the UK in past surveys - and the four large European countries Germany, France, Italy and Spain - exhibited similar patterns in our 2016 values survey.
For many purposes this skew is helpful - but as far as being a complete model of human motivations, as is often claimed
The purpose of good social and psychological research is to explore the robustness, and ultimately the usability, of various models. Using the standard OCEAN scales, we found some limitations. At CDSM this gave us motivation to find different techniques to explore ways of extending the usability of the data and gain new insights into the OCEAN model.
OCEAN-ography (exploring OCEAN) and Values - A new way of seeing
One way of seeing the data differently is to look at the opposite of the OCEAN factors, i.e. Not Neurotic, Not Conscientious, etc.
Some peer reviewed surveys have simple sliding scales effectively showing respondents who agree or disagree that the factor being measured is more or less like themselves.
CDSM used peer reviewed contrasting scales that measured, on a 6 point scale, how strongly respondents felt the factors were true about them.
When these contrasting scales are combined into a continuum of response the data appears in Values and Attribute Space like this.
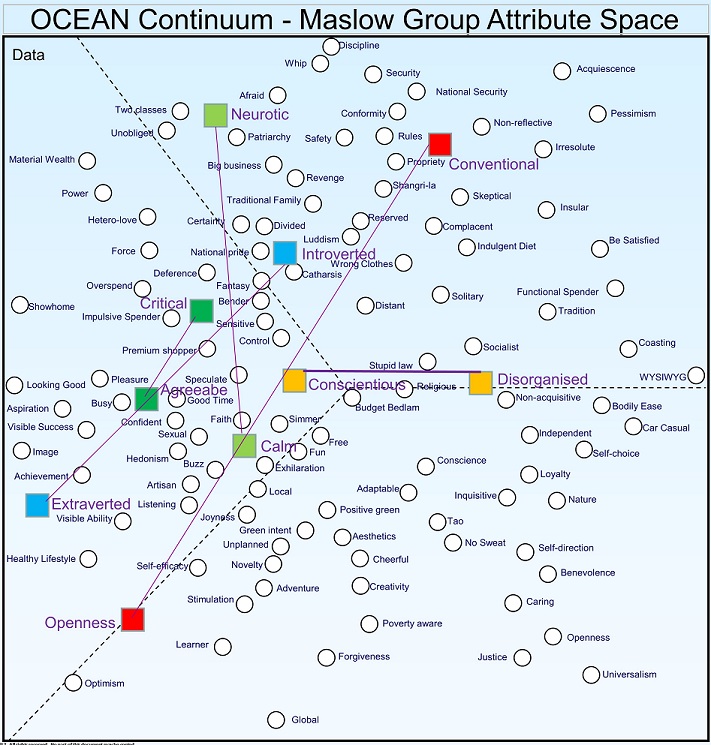
We first observed this pattern in 2012 and it has been replicated in every British Values Survey since then. The OCEAN model would appear to be stable, i.e. a good model.
However, though the model was stable, the literature search and review we had undertaken in preparation for that survey did not prepare us for the shape of the data when compared to the CDSM model developed over the four decades.
This got us wondering why the academic literature we had reviewed didnt seem to refer to this unexpected shape to the data. We initially thought this was because our values research was not directly comparable with Costa and McCraes model of personality. In previous research, comparing our values segmentation with other research models, we had discovered that standard personality tests seldom correlated with values research models. This had been independently validated by third parties.
These findings showed us clearly that values system research does not measure personality and that personality measures are valid only within a narrow area of human values typologies.
Changing Perspective for Users
This finding is significant for users of models that provide insights into human psychology. The selection and use of the best model is important to users and is often something that causes real headaches to strategic and tactical decision makers as they develop everyday business and organizational programmes to change human behaviour.
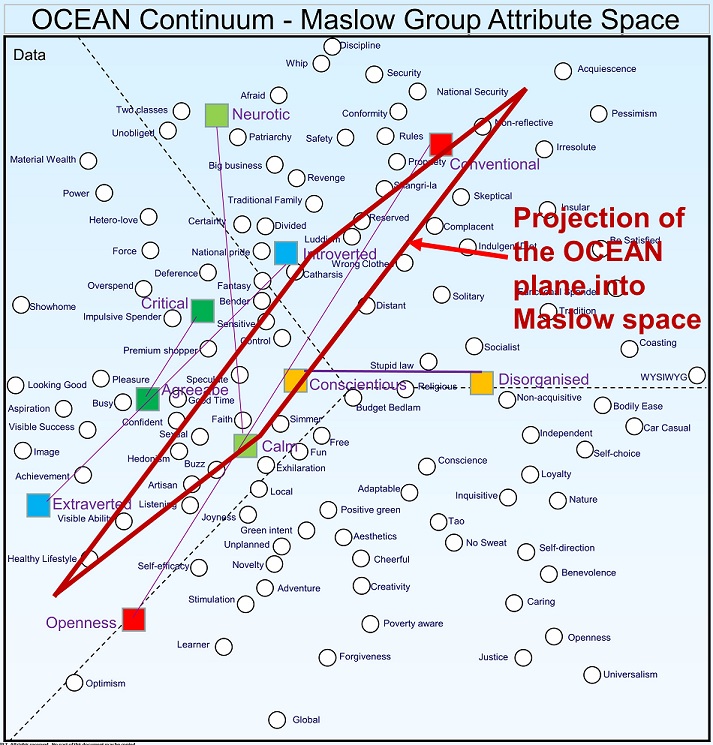
CDSMs statistics guru Les Higgins presented the following map before the next round of the BVS, which clearly told the story and allowed us to begin to develop and expand our next exploration into ways of providing more useable data for decision makers.
Les was able to demonstrate that OCEAN - while robust in what it measures - is orthogonal, not congruent, with the values space.
We felt it was time to incorporate this knowledge and look to expand insights for users and decision makers who may want to use hybrid models or combinations of models, i.e. new horses for courses.
From our decades of experience, we knew that many clients would seek a way of combining models to achieve better results (values and demographics or geo-demographics, values and behaviours, values and personality, etc.). Because of this, we continued to explore our data and modelling techniques to discover how to create a bridge between values and OCEAN; or even to discover if such a bridge were possible given that OCEAN had been revealed to be a quite different form of measurement compared to the CDSM values models.
The explorations were illuminating and exciting. Read about them in Part 2 in this series.